Dashboard
Overview of the OOS Dashboard, including system load, network traffic, and link status monitoring.
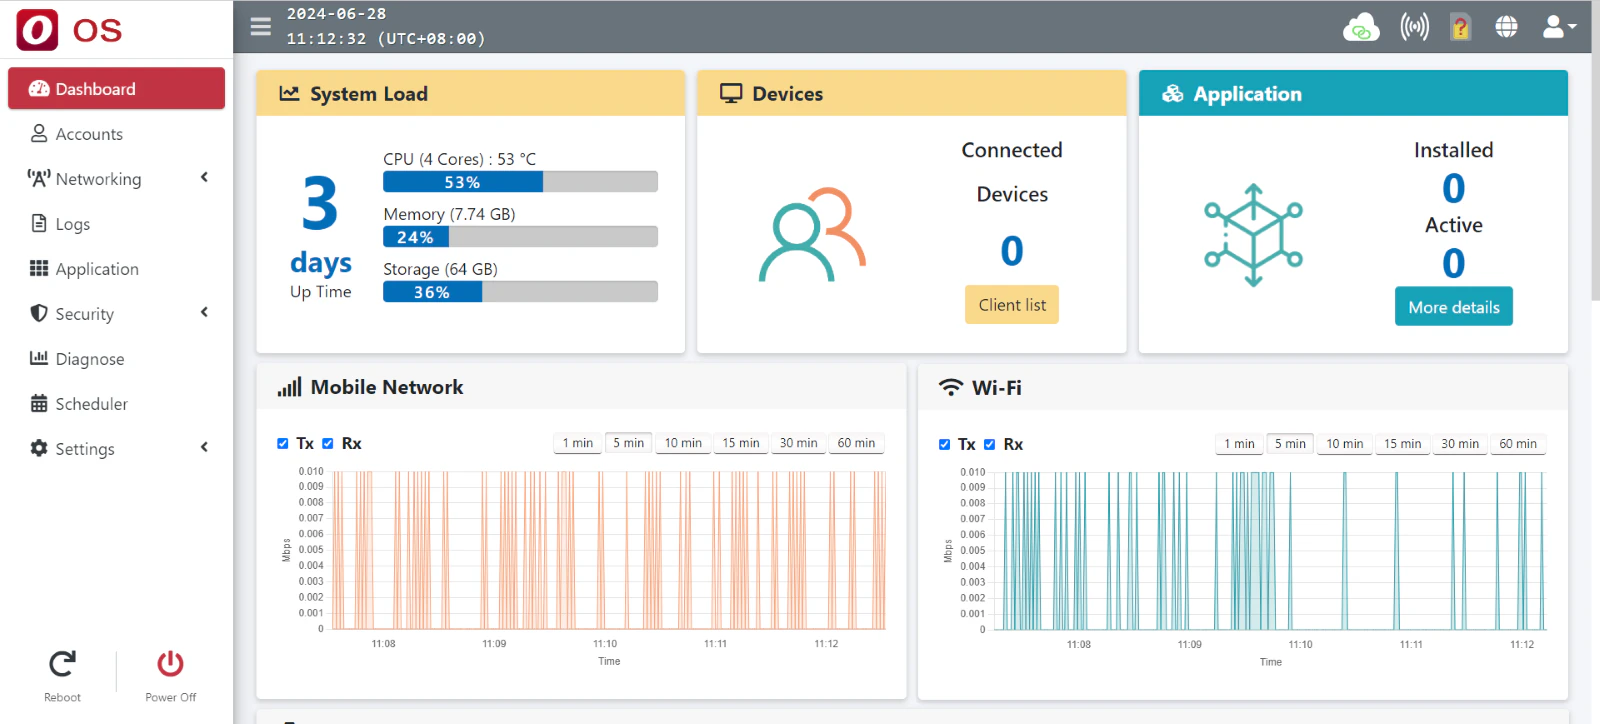
Upon logging into OOS, the Dashboard displays System Load, Connected Devices, Mobile Network traffic charts, Wi-Fi traffic charts, Link Status, Application status, and Ethernet status.
The Link Status displays real-time WAN and LAN statuses. The topology map reflects actual physical connections. Hovering your mouse over the node spheres, VLAN icons, or LAN icons will reveal detailed information. Port color distinctions allow quick identification of whether a LAN port is currently connected to a device.
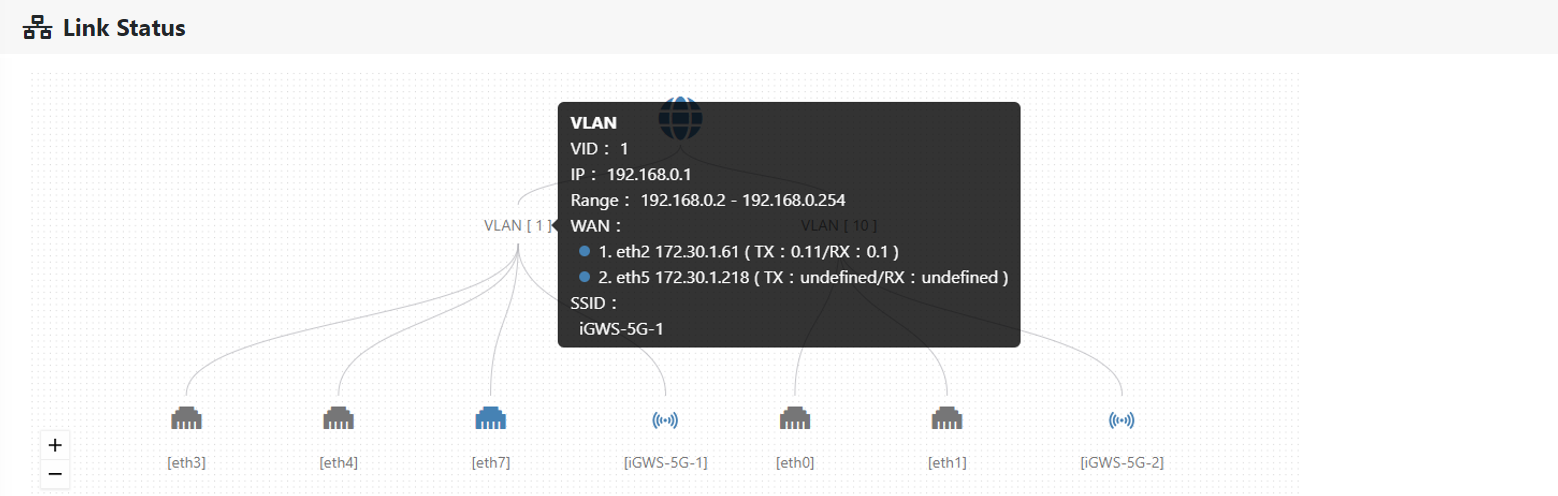
Link Status Icons
| Icon | Description |
|---|---|
 | WAN Connected |
 | WAN Disconnected / WAN Binding Not Configured |
 | Equipment Connected |
 | No Equipment Connected |
 | SSID Enabled |
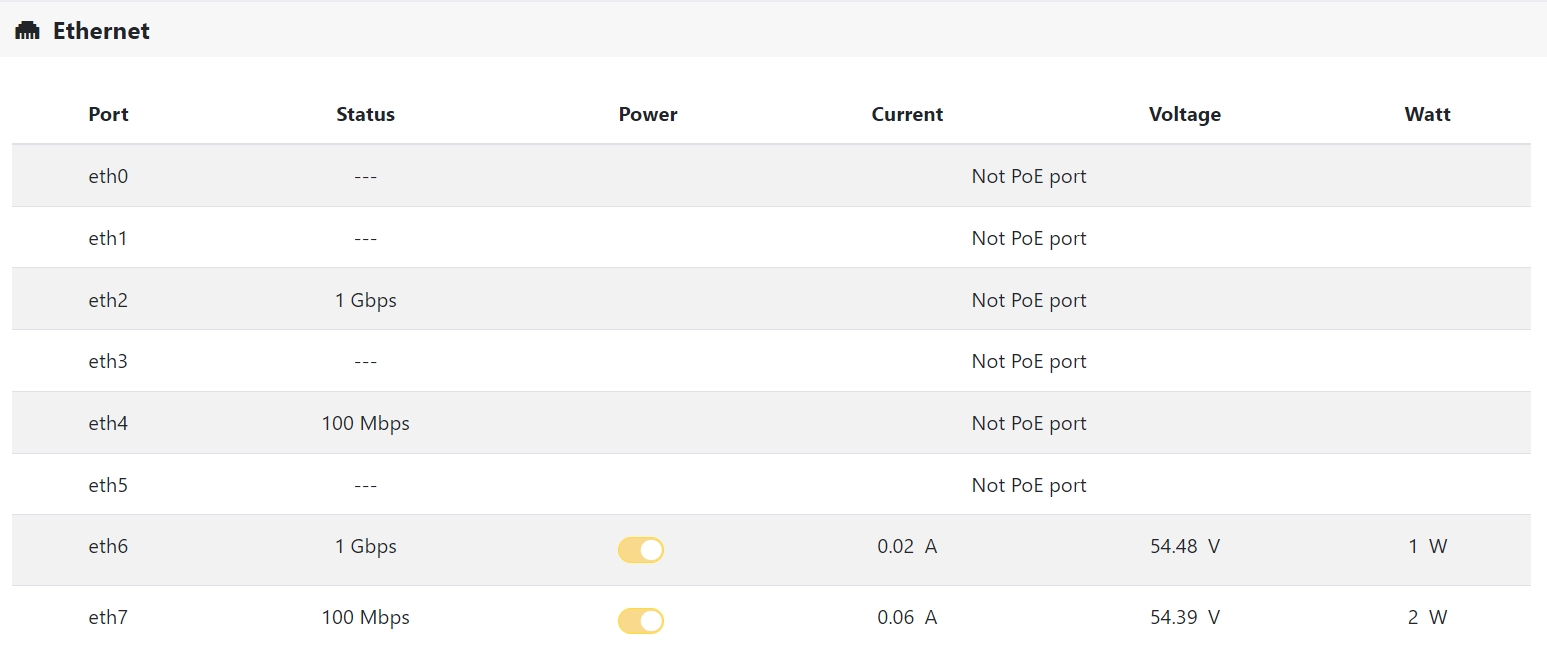
When a PoE adapter is plugged in, the POE Status table appears on the Dashboard. This table allows users to toggle PoE power delivery for individual ports and view real-time current, voltage, and wattage statistics.
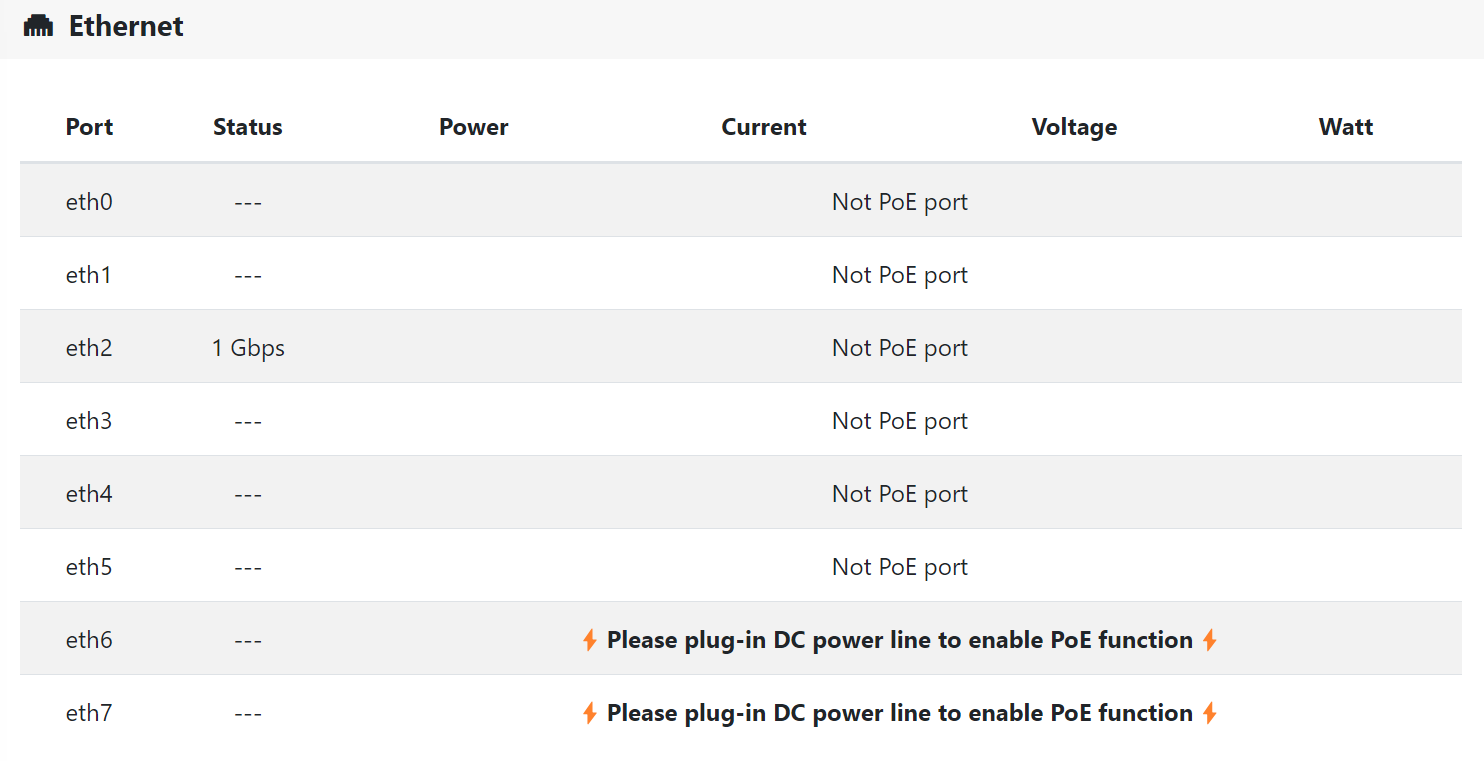
Display when PoE power and PoE equipment are connected:
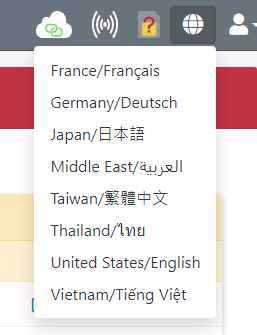
The OOS system supports multiple languages, including English, Chinese, Japanese, German, French, Vietnamese, Middle Eastern languages, and Thai.